Analyze Java application performance
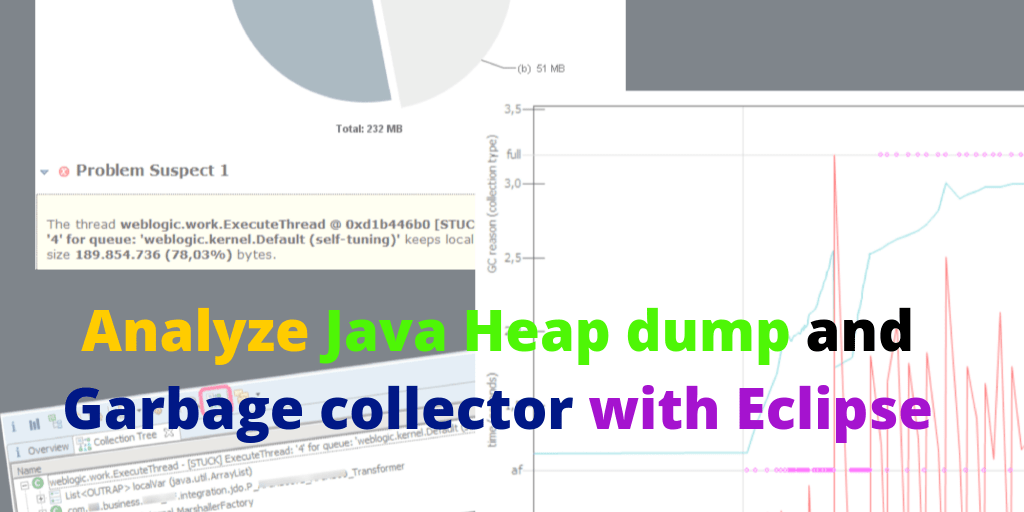
Java is the most popular programming language in the world and there are many tools to analyze Web and Android applications developed with this language.
Many Web Application use Application Server JavaEE as Oracle Weblogic.
You need to collect some fundamental data to analyze your Java application:
- Heap dump: the memory dump of the JVM process.
- Garbage collector log: “gc.log” where all JVM memory cleanup operations are tracked.
- Thread dump: application thread dump.
The following commands have been launched on Oracle Java and Weblogic.
How to capture java heap dump
Heap dump will help you observe objects in memory at a given time. So you can indentify the cause of “out of memory”,”memory leak”, etc.
Use jmap command in the java binaries installation folder:
Heap memory dump in hprof binary format:
jmap -dump:file=/var/dump/application.hprof pid # “pid” is the JVM ‘s Process ID or Weblogic application server
How to enable garbage collector log
The Garbage collector log, or gc.log, is the text file where all the JVM memory cleanup events are stored: MinorGC, MajorGC e FullGC.
Java HotSpot(TM) 64-Bit Server VM (24.85-b06) for linux-amd64 JRE (1.7.0_85-b15), built on Jun  8 2015 18:50:27 by "java_re" with gcc 4.3.0 20080428 (Red Hat 4.3.0-8)
Memory: 4k page, physical 3907408k(2024488k free), swap 6291452k(6150788k free)
CommandLine flags: -XX:CompileCommandFile=/opt/oracle-mw/config-12/common/hotspot_compiler -XX:+DisableExplicitGC -XX:HeapDumpPath=/spimi/tmp/bban0/ -XX:InitialHeapSize=1073741824 -XX:MaxHeapSize=1073741824 -XX:MaxNewSize=134217728 -XX:MaxPermSize=536870912 -XX:MaxTenuringThreshold=31 -XX:NewSize=134217728 -XX:OldPLABSize=16 -XX:ParallelGCThreads=3 -XX:PermSize=536870912 -XX:+PrintGC -XX:+PrintGCDateStamps -XX:+PrintGCDetails -XX:+PrintGCTimeStamps -XX:SurvivorRatio=6 -XX:+UseCompressedOops -XX:+UseConcMarkSweepGC -XX:+UseParNewGC
2019-05-20T17:02:57.481+0200: 5.350: [GC2019-05-20T17:02:57.481+0200: 5.350: [ParNew: 98304K->15755K(114688K), 0.0374830 secs] 98304K->15755K(1032192K), 0.0375900 secs] [Times: user=0.05 sys=0.01, real=0.03 secs]
2019-05-20T17:03:01.720+0200: 9.589: [GC2019-05-20T17:03:01.720+0200: 9.589: [ParNew: 114059K->16384K(114688K), 0.1030770 secs] 114059K->28497K(1032192K), 0.1031730 secs] [Times: user=0.10 sys=0.01, real=0.10 secs]
2019-05-20T17:59:33.800+0200: 174774.202: [Full GC2019-05-20T17:59:33.800+0200: 174774.202: [CMS2019-05-20T17:59:34.185+0200: 174774.587: [CMS-concurrent-mark: 0.625/0.633 secs] [Times: user=0.75 sys=0.00, real=0.63 secs]
Start JVM process with this flags to create gc.log:
until Java 8
-XX:+PrintGC -XX:+PrintGCDetails -XX:+PrintGCDateStamps -XX:+PrintGCTimeStamps -Xloggc:/opt/tmp/myapp-gc.log
from Java 9
How to take thread dumps from a jvm
A thread dump is a snapshot of all threads in the JVM process.
For Weblogic, these are the states more interesting:
- STANDBY: the thread is waiting to perform an operation
- ACTIVE: the thread is performing an operation and the stacktrace is reported
- STUCK: the thread is labeled stuck after a certain amount of time set on the Weblogic domain admin. Potentially this thread may be blocked or is performing an operation that is taking longer than X minutes.
Syntax for generating thread dump:
How to analyze heap dump e garbage collector log with eclipse
Use the Eclipse with MAT, MAT Easy! and GCMV plugins for analyzing the collected data,.
Official site to download Eclipse https://www.eclipse.org/downloads/. Eclipse Marketplace to install the plugins:
- Memory Analyzer (MAT): it's an Eclipse distro for memory analysis
- MAT Easy!: helps you find OutOfMemoryError (GitHub link)
- GCMV: plugin to create chart of garbage collector log
MAT – analyzing heap dump
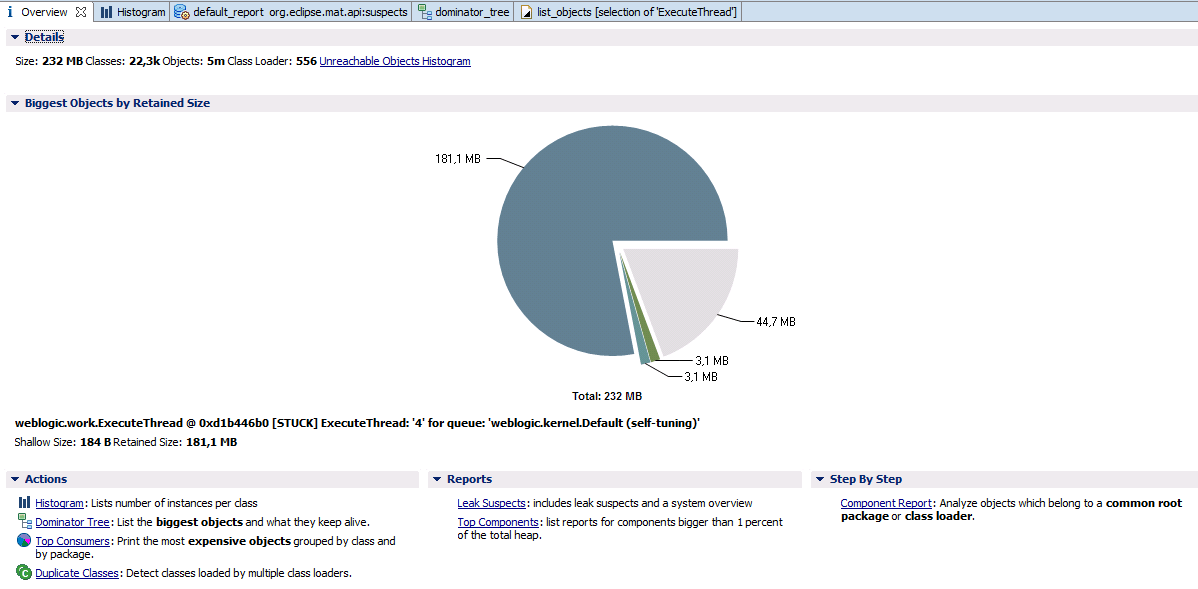
This is the first screen that will appear to you as soon as you have finished parsing the hprof dump. The pie chart helps you identify large objects (181 mb) in relation to the size of the Heap (512mb in this case).
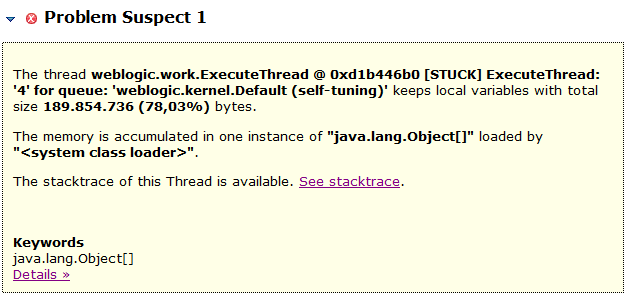
Leak suspects function automatically identified a Thread in STUCK, containing the object macro highlighted above.
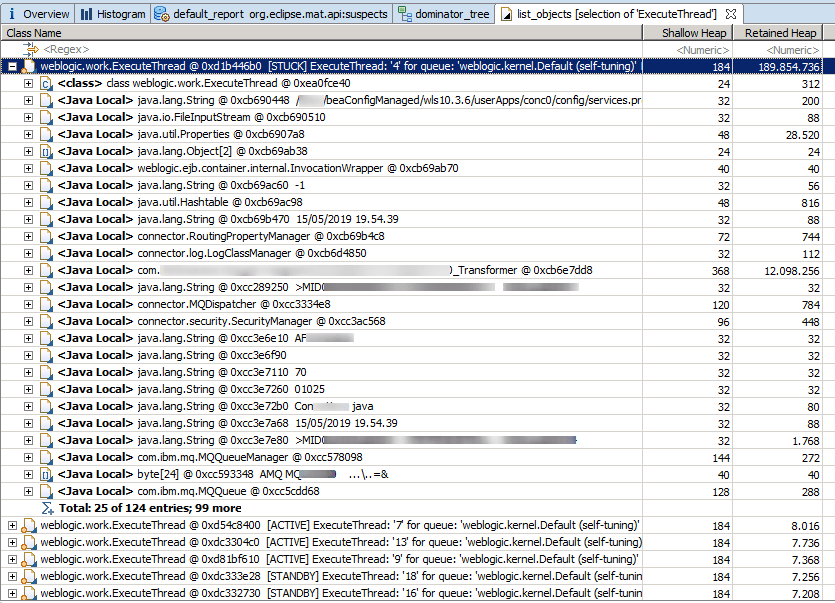
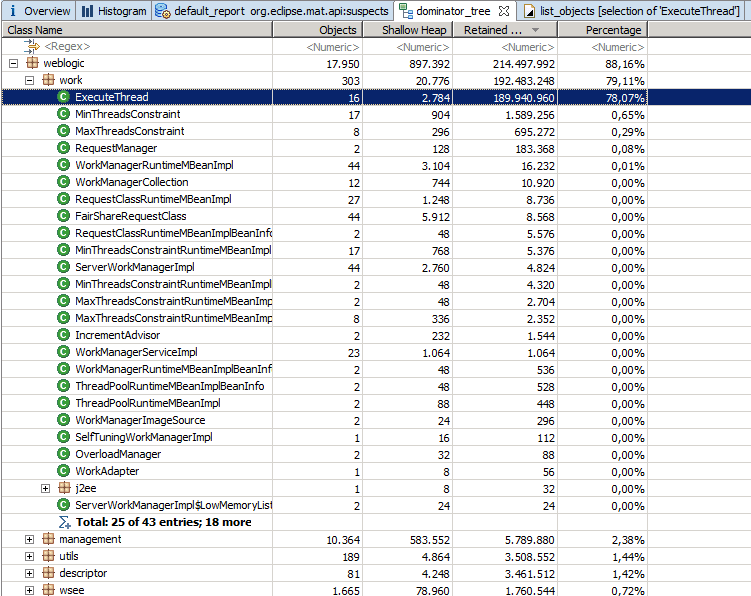
Dominator tree sorting by Retained Heap helps you to notice the weblogic.work.ExecuteThread object ‘4’ in STUCK.
MAT EASY! – easy analizing heap dump
With MAT Easy! is easier to see the data in the Dominator tree.
Click Collection Tree button to use MAT Easy!

With Collection Tree you can traverse objects more easily until you get to the contents of individual objects.
GCMV - plot gc.log
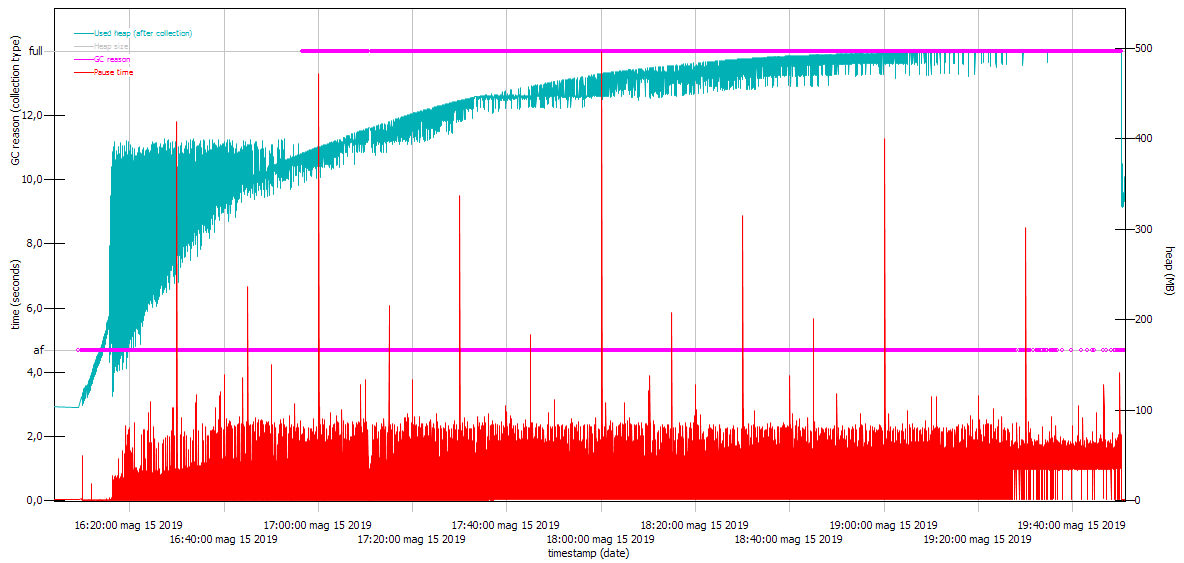
GCMV plots gc.log so you can analyze memory usage of your application.
Good analysis of your Java applications!